Did you know that the global image recognition market is expected to grow to $53 billion USD by 2025? As a marketer, you can ride this wave with the help of social media intelligence tools.
Images present you with a unique way of reaching out to your target audience. Not only are images more appealing than text, but they also have the potential to be shared more widely.
The number of social media posts containing images has been significantly increasing in recent years. Surprisingly, while most consumer brands monitor text mentions on a regular basis, visual listening is still considered an innovative strategy.
Visual mentions, however, often give more valuable insights than text. Why?
The first reason is that people frequently depict moments of consumption in their social media photos. It could be something as simple but important as inconvenient packaging. A customer may not write this in text, but rather take a picture that explains everything without words.
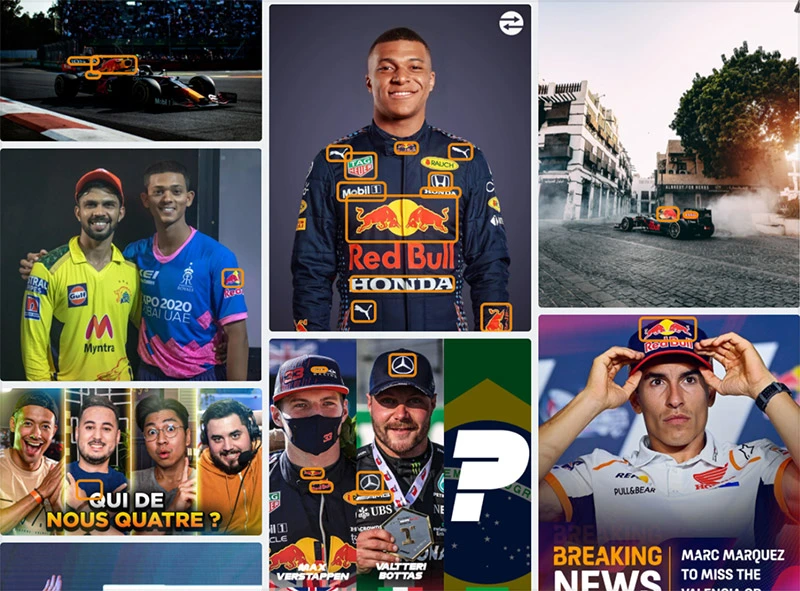
The second reason is that, in the text posts, a person has to mention the brand name (or other monitored keywords). Photos, however, can be tracked by the social listening tools if they feature a brand's logo; no text in the caption is required. Regardless of the industry you’re in, image recognition can help you improve your business efficiency.
If you want to invest in a social media intelligence tool, you need to start with some thorough research.
While there are many options out there, there are only a few that can do visual listening: Brandwatch, YouScan, Talkwalker, and Linkfluence. These companies offer a wide range of features, so we'll take them for comparison.
Table of Contents
How the Images Are Collected
Before we go any further, it is crucial to understand how image recognition works and what happens to images on a technological level.
In general, computer vision is an AI-based technology that allows the software to extract meaningful information from digital images, videos, and other visual inputs to later transform it into actionable insights.
Below, you'll find the collection methods for detecting and gathering relevant images:
- Logo detection: Visual appearance of distinctive, often trademarked, graphics that identifies a brand.
- Text recognition: Conversion of visual text (either typed, handwritten, or printed) into a machine-readable format, also known as OCR (optical character recognition).
- Image similarity: Finding images that look identical or similar to a certain degree.
- Pre-defined search query: finding images that contain particular elements
Along with image collection, computer vision technology simultaneously analyzes each photo in real-time to extract data points that are later utilized for further analysis.
Here is what some of the processes look like:
- Image analysis: High-level understanding of the visible contents by determining whether an image contains a specific object, scene, or activity.
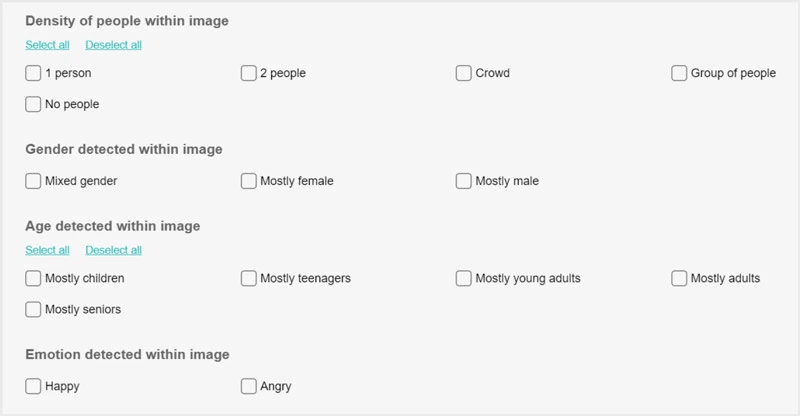
- Human characteristics: Detecting people portrayed as well as their properties.
In a nutshell, modern tools powered by image recognition can not only simply collect images in various ways, but also examine them and comprehend what is depicted on them in precise detail.
The more data points a social media monitoring platform collects, the more accurate and informative the analytics provided to its users will be.
Data Sources
Whatever the objective, you can only achieve it with sufficient visual materials.
With the recent rise of TikTok as an essential global social media, maturing influencer marketing, and adaptation to post-pandemic conditions, the needs are constantly evolving.
Let’s see which channels the tools we listed at the beginning of the article have to offer as image sources:
Brandwatch and Talkwalker are two of the 13 official Twitter partners, which means they have real-time access to the entire stream of tweets.
As a result, most of the images they collect come from Twitter, which is not a visual-first network — so if you're looking for specific visual mentions, the coverage will be limited.
Talkwalker, though, is the only one processing video content. Be advised that it only works for logo detection and only on Twitter. This feature is something to watch, as video is swiftly taking over social media.
YouScan monitors all kinds of social media platforms as well as other sources like marketplaces, review websites, and forums. Depending on your goals, some sources might be unique and valuable, so we recommend researching them further.
Linkfluence has a moderate sources collection; however, it does monitor Pinterest, while others don't cover this network yet.
Logo Detection and Accuracy
While the feature seems to be straightforward, there's more to it than simply telling whether or not the logo is present in the pictures. First of all, the logo can be of poor quality, rotated, or partly seen.
So, not only does the size of the logo library matter, but also the detection accuracy. Detection accuracy, in turn, has two primary metrics: recall (percentage of detected from those present) and precision (percentage of correctly identified from those detected).
High precision rates reduce manual curation work, suitable for researching buyer personas or product consumption. In contrast, sponsors would like to see a high recall rate that helps collect all brand appearances from an event.
Brandwatch's brand visibility report mentions “a library of around 800 logos,” but there may be more. While Brandwatch used to outsource computer vision technology to Visua, its AI capabilities improved with the acquisition of Crimson Hexagon a few years ago. Still, data on computer vision accuracy is not available.
YouScan has a collection of 600+ logos, but new ones can quickly be added on-demand. This tool stands out for its computer vision accuracy as it can detect small, unclear, tilted, partially covered, and otherwise obscured logos.
Talkwalker claims to have a library of 30k logos, which seems prominent but somewhat redundant, even if you want to track all your competitors or the whole categories of products. The tool appears to be very accurate in terms of logo detection, with few errors, though recall may be an issue.
In the past, Linkfluence detected logos with OCR, i.e. only those that are text-based. Detection accuracy data is not available for this tool.
Text Recognition
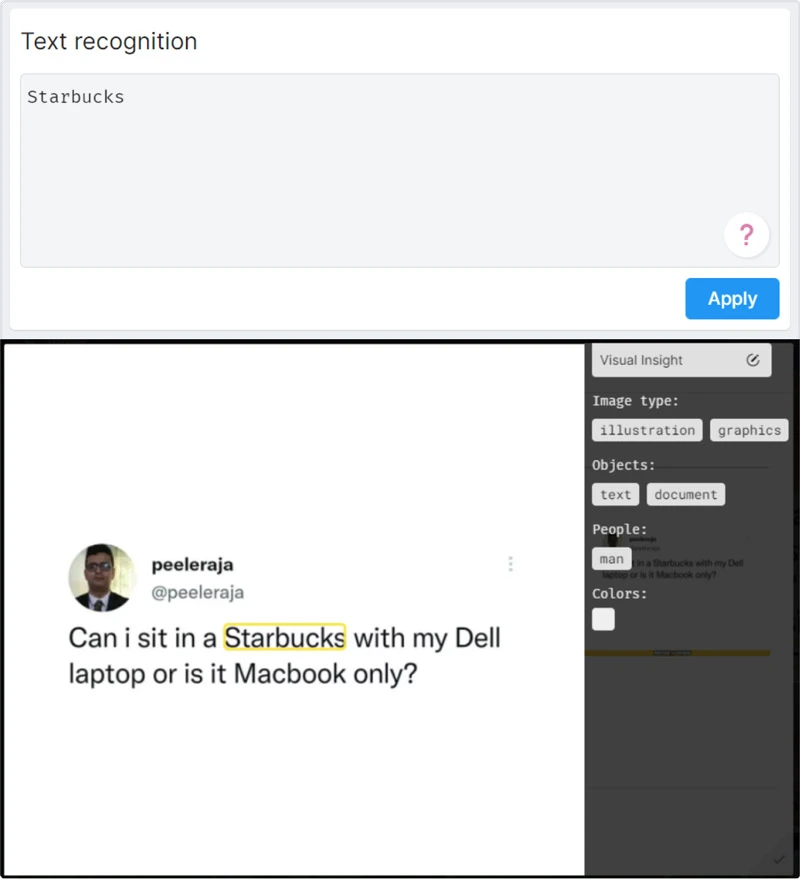
Text recognition (also known as OCR) scans hidden keywords, text logos, titled photos, and meme headings. Imagine combining your logo (such as Starbucks) with a product line name (such as “Latte”) to get an exact selection of brand appearances.
Coupled with image analysis, it is your best research friend.
This capability is also helpful for monitoring your brand name as text. Think “Starbucks” embedded into a popular meme with either negative or positive sentiment.
In the example of YouScan, you can see how to set up the query so that the tool will collect all visual mentions where the brand's name is written in text, even if the logo is absent on the image.
How the Images Are Processed
Looking into visual content at scale is probably the least understood and the most undervalued option for marketers. Image analysis allows them to see the complete picture of how customers and creators perceive their brands.
So, what happens after the image is collected?
As mentioned before, AI extracts various data points to understand what's depicted in the photo. Important notice: AI can only recognize entities and concepts it has already learned; it won't recognize oranges after being familiar only with apples.
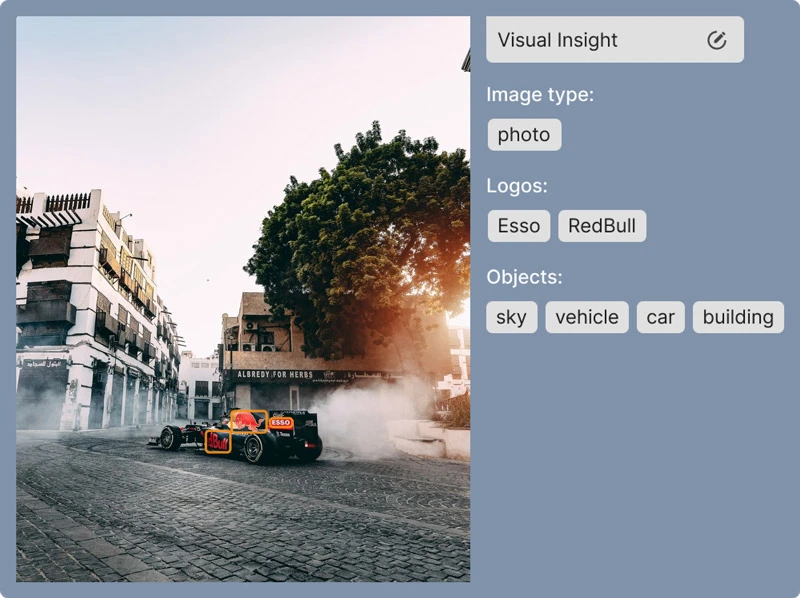
Usually, these categories are called labels. In a nutshell, visual labels are keywords tags that describe various meanings depicted in an image. “Apple,” “Garden,” “Cooking” are examples of objects, scenes, and activities.
Aside from that, sophisticated tools can distinguish label levels and sort them accordingly. For example: food > baked > pastry > cake > cheesecake.
If you aim for insight discovery, be sure to choose a solution with the most breadth and depth of visual labels.
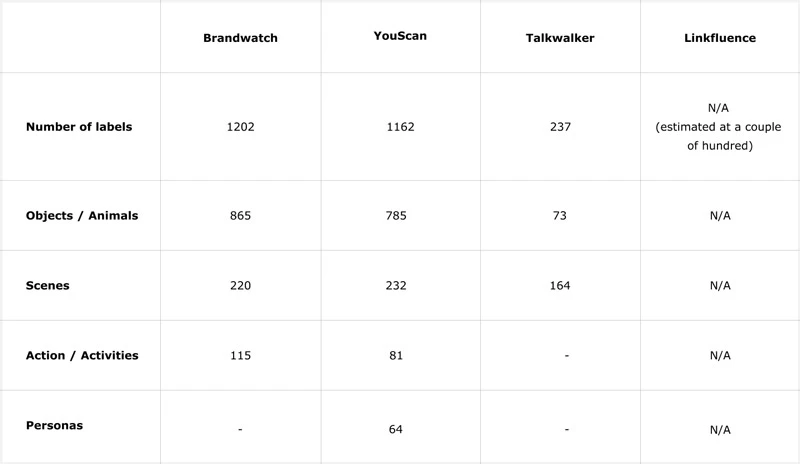
Each software solution has a different set of labels incorporated into its computer vision:
Brandwatch and YouScan clearly have the edge on understanding the visual content. The more labels a tool can identify, the more precise and detailed the analytics.
As a result, these two vendors can evaluate who, what, and where is depicted on images along with your brand logo.
The visual analytics capabilities of Linkfluence and Talkwalker, on the other hand, are more limited due to a smaller number of available labels.
How the Images Are Turned Into Insights
Now that it's clear how the data is collected, let's move to the analytics part. In a nutshell, the primary function of any social media intelligence tool is to convert monitored data into understandable conclusions and actionable insights, rather than merely track brand mentions.
So, let's compare how data is presented to users by Brandwatch, YouScan, Talkwalker, and Linkfluence.
Content Filters – Browsing Data
While collection allows searching all the relevant imagery, filters narrow down the selection to the most meaningful instances. The statistics attached to the filters can also give an idea of the most popular visual topics appearing in the conversations.
- Brandwatch is very limited in how you can drill down into the visual content. It only features a single filter that configures data available to dashboard widgets in the Consumer Research app. It is called ‘Image insights’ and requires a logo query.
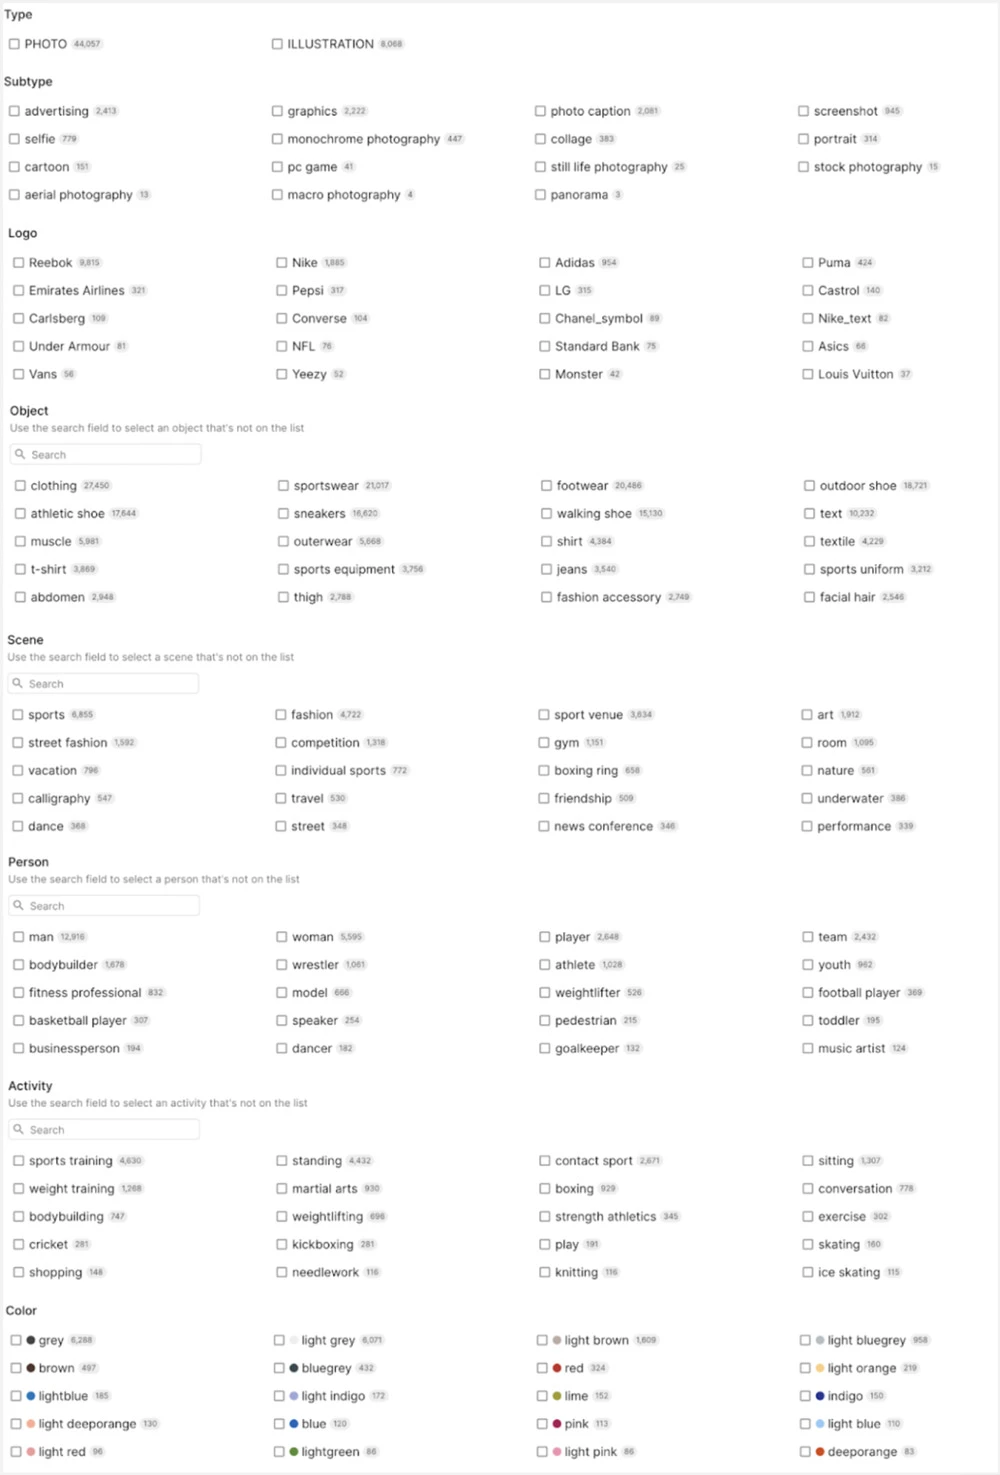
- YouScan boasts the most granular filters that you can mix and match with advanced boolean logic between them.
Do you need to see the sports, but only ball games, and not racing? How about a product trademark used in a recreation setting, more specifically on the beach? These are the types of contexts that you can explore in-depth.Even if you are collecting only one logo, other appearing brands will be available for filtering, which helps to track competitors, for example.Overall, there are eight different sections that you can tune to find precisely the objects and scenes that you need, including image type, subtype, logo, object, scene, person, activity, and color.
- Talkwalker does not allow filtering visual content. It has to be set up as a topic at the content collection level in Settings by selecting brands, objects and scenes to be included:
Clickable items in the “Visual Insights” section bring up a popup with ‘Top Mentions’ filtered by the selected criteria. There’s no title or other indication of what those are while you are browsing the content, nor can you change active filters.
- Linkfluence provides a limited number of default visual filters in the “Overview” and “Posts & Analytics” pages:
Clickable items in the “Image recognition” view update the selection, compensating the above constraint and making filtering more flexible.
Image Gallery – Visual Mentions Feed
Computer vision is only nearing the human level in terms of accuracy. Some use cases require manual involvement to review and curate images. Once checked, they form a quality dataset for analysis and decision-making. An image gallery is where it usually happens.
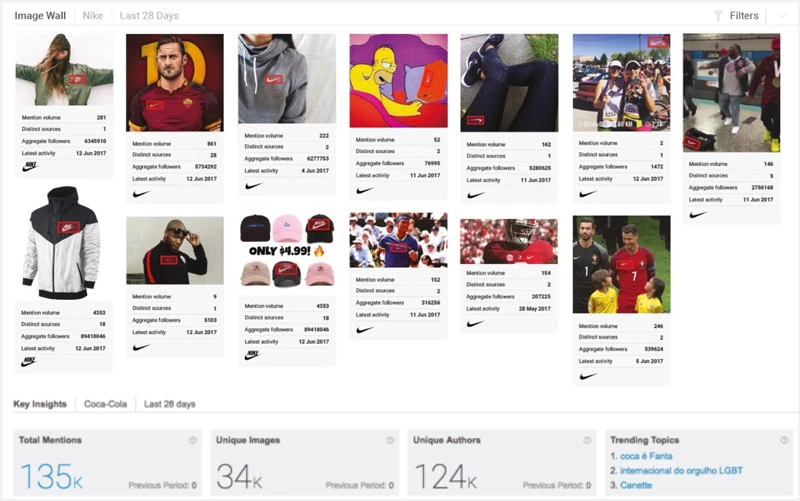
- Brandwatch displays all the images collected by logo in a dashboard component called “Image wall” where you can also see “Key insights” statistics.
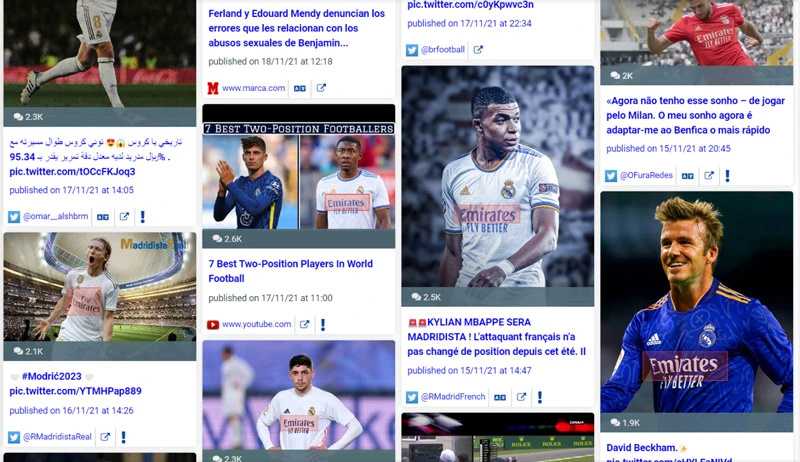
- YouScan has a dedicated section called “Gallery” for this purpose, not just a grid view in the mentions stream. It is a classic picture wall with large previews sorted by engagement. You can click on each image to see the details.
- Talkwalker allows converting any list of mentions (such as “Most engaging posts” or “Recent images”) into an image gallery. However, it is best presented in the “Top results” popup via context links from analytics charts, serving as a filter.
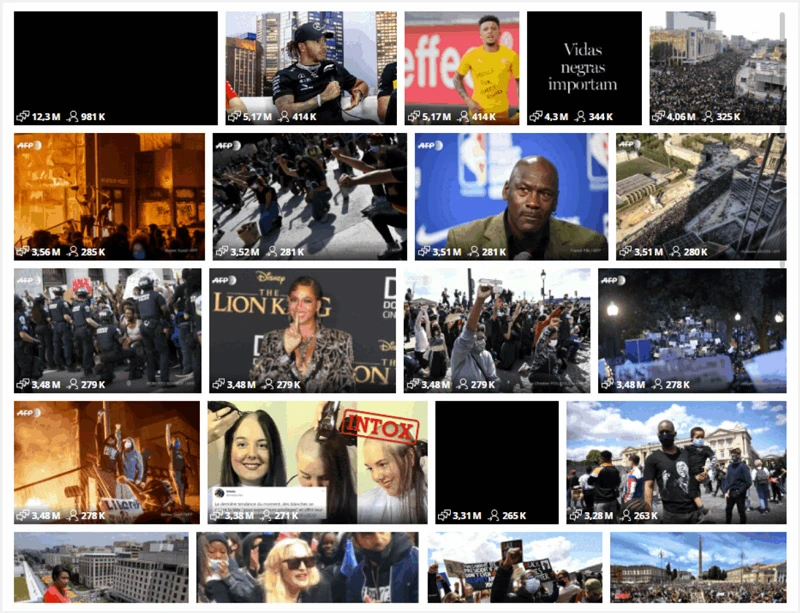
- Linkfluence offers “Picture wall” as a default widget in its “Image recognition” view:
Clicking an image brings up a web view of the post, tagging options, and identified meta-data. No image labels are available.
Data Visualization – How Insights Are Displayed in the Tool
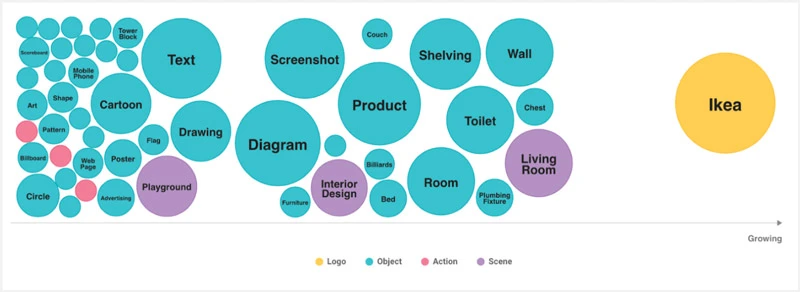
- Brandwatch visualizes the insights extracted from images with two clickable and configurable dashboard widgets: “Image wall” and “Image analysis.” These bubble charts provide an overview of labels for the logo/objects/actions/scenes.
Clicking labels conveniently brings up a list of filtered mentions on the right without leaving the page, but you can't see the images themselves.
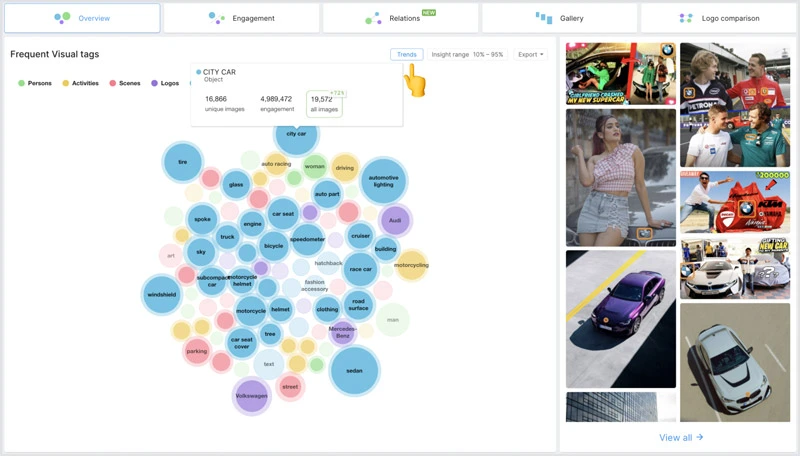
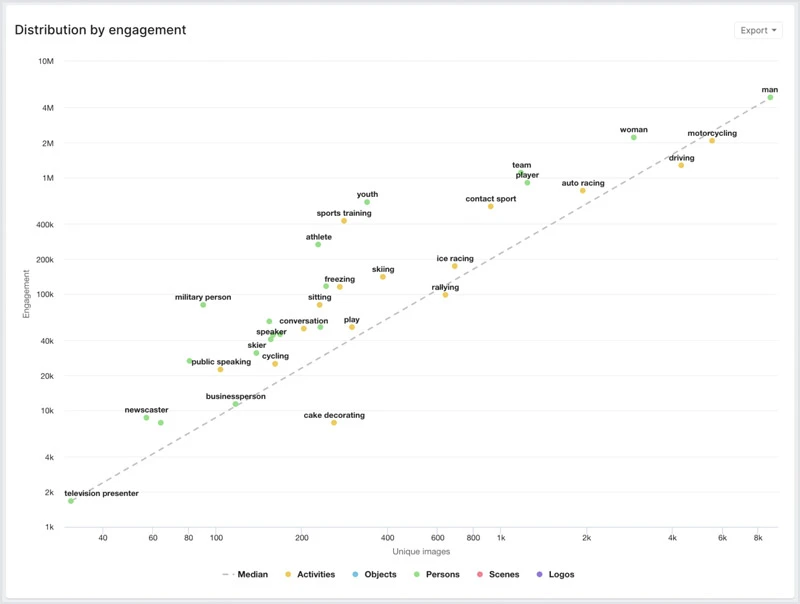
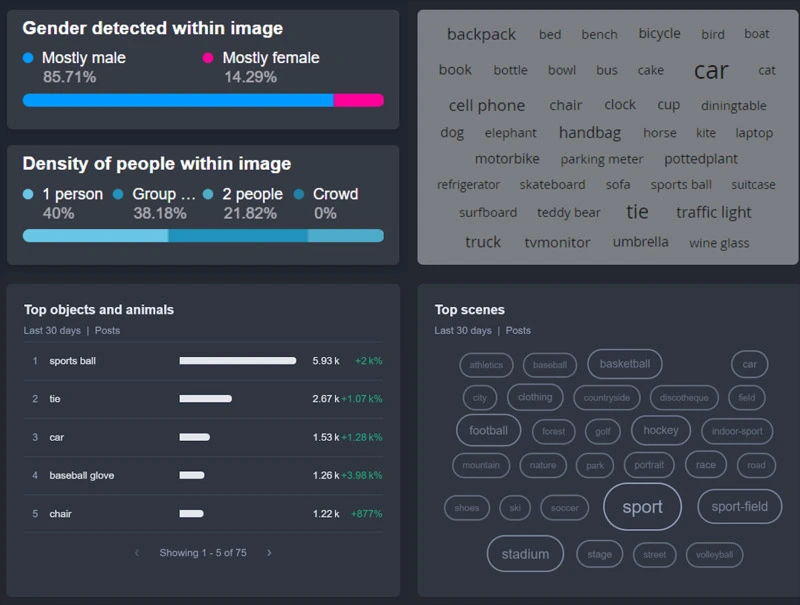
- YouScan features five sections of pre-configured visualizations called “Visual insights.” In the overview section, users can see the most popular objects, scenes, brands, and activities within a monitoring topic. When the “trend” feature is on, they can also check how the labels' popularity has changed over time.
The next visualization is an engagement chart that determines which visual elements such as objects, scenes, people, and activities drive more engagement. The graph is interactive, meaning users can also tap on each label to see all the related images.
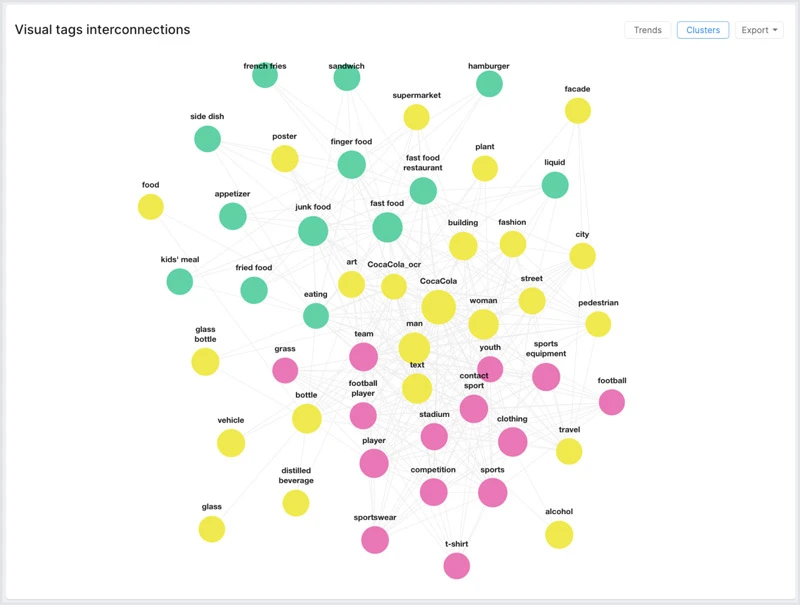
The “relations” section is similar to the bubble chart from the “overview” section, but it also detects connections between different visual labels and groups them into clusters based on a shared meaning.
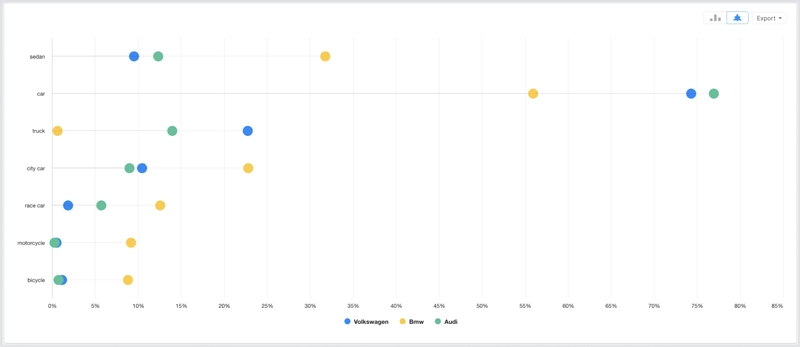
And the last, but not least powerful feature is a logo comparison chart, which allows to compare the context of images featuring a brand’s logo with its competition and find the differences or similarities between them.
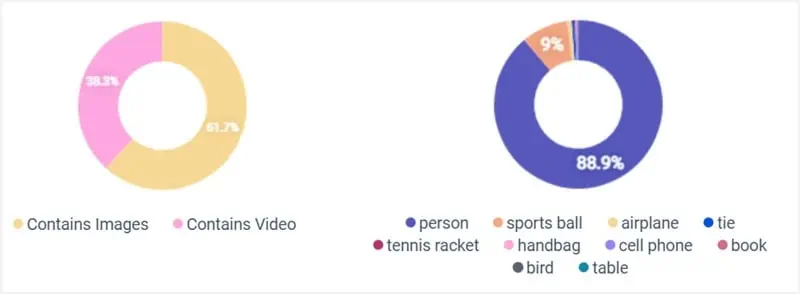
- Talkwalker provides a handful of charts, yet all have a configurable layout offering a range of visualization options. Each figure is clickable and brings up a standard “Top results” popup described above.“Share of content” displays the percentage of images, videos, and audio. The most insightful area, though is “Top identified options,” though labels are not very granular.
There’s also the “Affinities” widget that displays the brands that appear together most often. - Linkfluence offers several pre-configured areas in the default “Image recognition” view. They are human-related statistics and image labels cloud. The dashboards are manually assembled in the “Insight pages” section and can visualize the humans or label data in various ways.
Which Platform Has the Best Visual Analytics?
Having compared the four leading players in the visual listening market, we can say that each vendor has its strengths and weaknesses.
While marketers should choose software depending on their business needs, it's clear that YouScan and Talkwalker appear to be the most advanced tools that can tackle various challenges for every industry.
However, because businesses often rely on one provider at a time, we decided to highlight the main pros and cons of each solution:
- YouScan – has more proficient features, including a rich sources database, high logo detection accuracy, and insightful analytics. Even though the logo library might lack some logos, new ones can be quickly added upon request.
- Talkwalker – has the best video recognition, useful dashboards, but a limited variety of sources and visual labels, which make visual detection less advanced.
- Brandwatch – has a well-developed image recognition technology and can identify multiple labels, but the sources library is limited to only three social networks, and the analytics are rather basic.
- Linkfluence – has a reasonable number of sources, but the logo collection is small, undermining the final analytical capabilities.
We hope that this extensive comparison will save you time and allow you to select the visual listening vendor that best meets all of your company's image recognition and analytics requirements.
Social media intelligence can guide you to make smarter business decisions. If you want to get ahead of your competitors, it’s time to use it right away!
Do you have any questions about social media intelligence? Please feel free to add them in the comments section below.





Related Articles
The Right Time to Post on Social Media: A Reliable Guide
7 Best B2C Marketing Channels for Social Media in 2024
How to Grow Social Media Organically: 19 Tools You Need To Use in 2024
30 Best Social Media Marketing Tools in 2024
7 Social Media Analytics Best Practices You Should Follow
19 Best Social Media Management Tools for Marketers in 2024